Pixels
Posted on October 30, 2016 | Reading time 5 minutes- We will try to work out a definition for pixels
- We will see how the “correct” definition comes into play, when we resize images
Introduction
In the past posts, we sometimes talked about pixels - but what exactly are pixels? Most of the time, pixels are treated as a dimension. And while this is not entirely correct, I want to go into more detail here. When you look closely at your monitor, you will see that the display contains millions of tiny lights. Each light usually consists of three even smaller ones - red, green and blue. And if you’ve read the article on color spaces and models, you might think, that a pixel is such a physical “dot”. This is not entirely correct. A pixel - in a digital sense - is an information stored at a given point. This point doesn’t have an inherent shape or size.
The idea of a pixel can be hard to grasp, so let’s create a few sample images. Let’s imagine we have a two pixel image, with a blue and a red pixel. Now, let’s say we have a monitor with only three pixels:

This is our huge monitor with a size of three by one (physical) pixels
If we display our image in its original size, each pixel (of our image) will result in a box with the size of each lamp of the monitor

Our boring image
If you displayed the original 2 by 1 pixel image on your real monitor, it would be real tiny. But since our “sample” monitor has only three huge LEDs, the image is huge. So you can see, that the actual “size” of the displayed pixel is affected by the displaying device. We could also have round LEDs, or rectangular ones. This would obviously change how our image appears to the end user. Interestingly, this can become an issue for some software. Nowadays, small displays have a huge number of pixels. Older software sometimes has user interfaces with a really low resolution. This can cause these interfaces to become really tiny, making it necessary for your operating system to enlarge the application. This can cause blurry pictures. But why do images become blurry?
Scaling pixels?
You can obviously increase the size of images. For instance, in the example above, we could image that we resize the image by a power of two. So on a display, we could paint two pixels blue, and two pixels red. We could increase the size threefold, and paint three pixels blue/red, and so on.
But what we are actually doing here is interpolation. When we scale our two pixel image by a factor of 2, the original “location” is multiplied by two. The remaining pixels are filled (in our sample) with their nearest neighbor - we are doing nearest neighbor interpolation. This is often times to scale images, without altering their content. Consider the image below. Information on the color is only stored on the black points (pixels). However, due to next neighbor interpolation, the remaining pixels get the color of the closest (original) information assigned. This results in a blocky look.
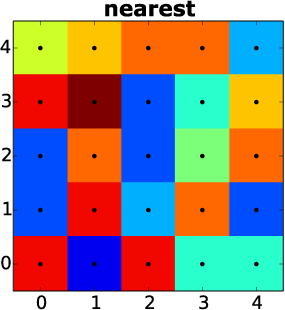
Nearest neighbor interpolation. Adapted from Zykure, see sources at the end
There are other interpolation methods available. The need for these methods is obvious, when we want to scale our 2 pixel image so that it fills the three pixel monitor. In order to achieve this 150% size, we need to infer the third pixel:
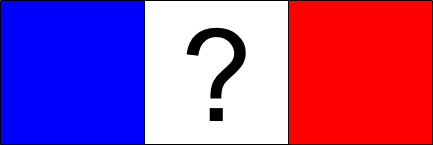
Scaling the pixel from earlier, we need to interpolate the question mark
We could assume for instance, that the intensity of blue changes from 255 to 0 from left to right. The intensity of blue would ramp up inversely. So we would end up with a color with an intensity of 128 for red and blue:
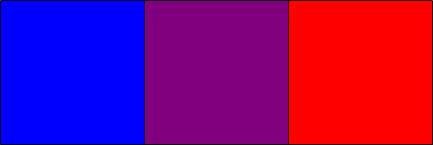
Linear inference yields a purple color for the missing pixel
We end up with a purple color through our linear interpolation. Thus, resizing created new information not previously present in our image. When you interpolate in two dimension, you have a process called bilinear Interpolation. This process also assumes, that intensities ramp up from on pixel to the next, across two dimensions. You can also try to use cubic functions, which is based on more pixels. The results look (for real) photographs nicer. With the example from earlier, the two interpolation methods create this:
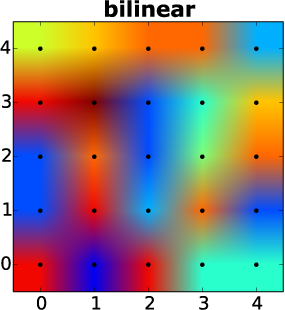
Bilinear interpolation (adapted, Original: Zykure)
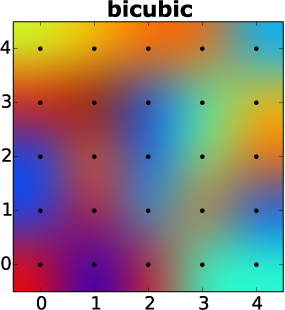
Bicubic interpolation (adapted, Original: Zykure)
You can see, that both methods created new colors, which were not in the original data.
Outlook
This example highlights, that resizing will alter your data. Linear and bicubic interpolation of your data can and will create artifacts. These can sometimes be desired. Interpolation with cubic methods can cause “overshoot” of “assumed” intensities and increase the contrast at the border of features of interest. But at the same time, both methods change the overall and average intensity. The changes might be minimal, but you should always prefer working on original data.
The method that present the “truest” data is nearest neighbor resizing. This approach however can’t seamlessly create images of all sizes. But if you need to magnify an image to look at details, this should be your method of choice. You can check if your image editor is using nearest neighbor interpolation. There are two good indicators for that:
- You can’t zoom seamlessly, your editor instead “jumps” between magnifications
- Your image becomes blocky at high magnifications
With that we have seen that working on original data is the best data to work on. Interpolation also happens when you rotate images by angles that are not multiples of 90°. Now, it would be interesting to assess, how the intensity is affected in theoretical and real world samples. But this is another topi for another time.
Image sources
The original images can be found via the links below: