An introduction to color
Posted on September 28, 2016 | Reading time 6 minutes- You will get to know what color spaces are
- You will learn how colors are represented
- You will understand the acronyms RGB
What are color spaces?
Everyone has someday painted something in watercolors — maybe you had art in school or maybe you’re an artist an draw with this as hobby. When you mix watercolors you end up with a new color: you mix yellow and blue and the result is green for instance. Now imagine you were given a paint set containing only red and blue. Now all your artwork would only consist of red, blue, and mixtures of both colors (various shades of purple and violet). The color space of your paint set would contain all the possible results of mixing different amounts of both colors. You could also make a certain color reproducible with simple instructions, e.g. you could say “mix 1 part blue with 2 parts red”, and every person with the same paint set would get the same result — at least in theory.
Now, let’s get back to the real world. In digital imaging and displays, colors are composed of red, green and blue. But in contrast to colors on paper, light will mix additively, i.e. the combination of all three colors will result in white, and green mixed with red will result in yellow. If you’ve worked with fluorescent images, you will recognize this behavior from creating merged images. For our purpose we will say, that all the resulting colors you get when mixing red, green and/or blue light are our RGB color space.
Color models
The term “model” in “color model” should be understood in a more mathematical or statistical way, meaning that it describes something. More precisely, a color model describes how to generate a specific color. Do you still remember the example above? The color model we used was a relative one. You could also say “mix 10g of red with 20g of blue”, and you would obviously end up with the same color. It follows that the color model is a instruction on how to generate a color in a color space
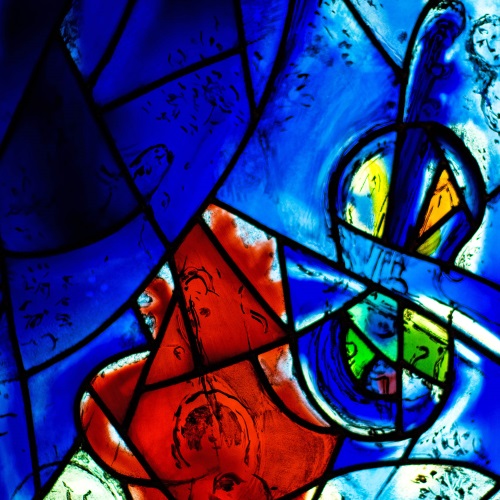
This detail of a Chagall Window can only be shown, because your monitors color space contains all its beautiful colors!
The RGB model
Let’s look again at our real world example — the monitor. Every point on your monitor actually consists of three smaller lights: red, green and blue. A simple RGB color model would tell each of these lights how bright it should shine to generate a specific color. To show a red point on your display, only the red one is necessary, the other two lights can remain off. But if you want an orange point, you would need a high intensity of red, a medium intensity of green, and no blue. The more green you add, the more yellowish your orange becomes.
With the RGB color model we describe each color as the amount of red, green and blue needed to mix this specific color using light.
We can use this model, to extract information about a color. For instance, let’s extract the amount of red, green and blue from the example image above.
Original

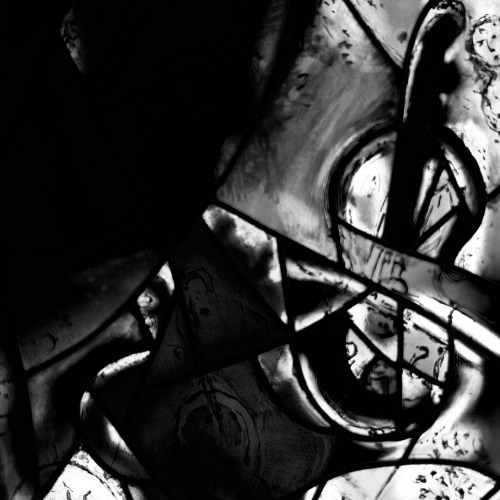
Red
Green
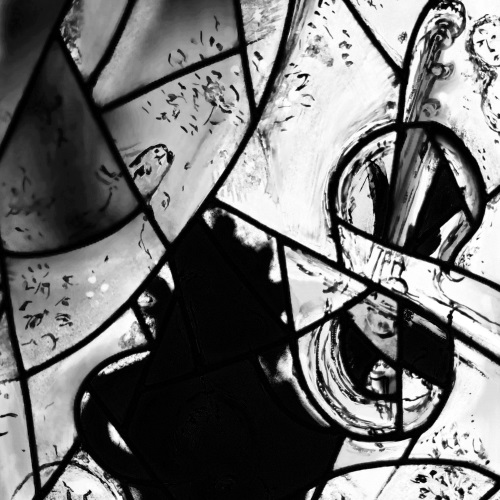
Blue
From now on, I will speak of a channel, when I refer to a single aspect of a color model, e.g. the red channel represents the amount of red. Above, I’ve split the original into its three RGB channels. Since we now only have a single intensity — e.g. the intensity of red — we receive a grayscale picture as result. If you work with fluorescent microscopy, you can also think of the colored image as a merge of the three grayscale images.
You can easily see in the pictures above, that black appears as black in every channel (compare for instance the dark wire frame). Now pay attention to the rose in the bottom left part: since it is red, the red channel shows this rose very clearly, while the other two channels remain almost pitch black here. If we were interested in extracting this rose automatically, we could use the information in this channel. If we were more interested in the background, we can look at the blue channel. Do you notice how most of the image appears very bright in this channel?
The HSV model
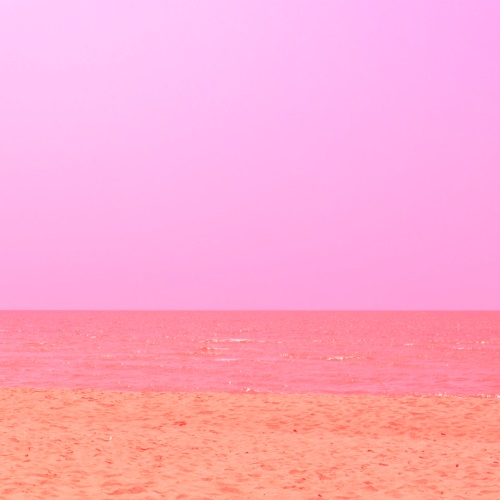
Thinking with this RGB model can be quite counterintuitive. Let’s image we are working on a digital image of a blue sky. Since we think this blue sky is boring, we want to turn it into a nice red sunset sky. Now, since we’ve learned that every color has a red amount, we just increase that. Let’s see what happens.

Original
Increased red
Now our blue has turned into pink. But if you think about it, that makes sense: With additive mixing, the mixture of blue and red results in pink. But when you draw an image, you usually don’t think of colors as a mixture of RGB. You most likely have an idea of a color: yellow, red, blue, green, purple, … And with every color, you decide if you want a strong pink or more of a pale pink. Maybe even a dark pink. This is where HSV comes in.
The HSV color model describes a color with hue, saturation and value (the latter sometimes replaced with brightness, the result would be HSB). The interpretations of each letter can be best understood with a diagram.
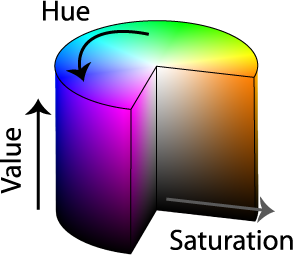
The HSV model can be represented as a cone. Adapted from Jacob Rus, licensed under CC BY SA
The hue is often represented as degree and represents the color. Red is located at 0°, green at 120° and blue at 240°. The remaining colors along this circle are a smooth transition.
Saturation can be seen as “white amount”. A 100% saturated red would be the fullest red you can see — conversely a 0% saturated red would actually be white.
Last but not least: value. This one is often called brightness and does as expected: 0% brightness is black.
Starting with an RGB color, it is actually possible to calculate the values of HSV. Fortunately we have programs which resolve this task for us.
Original

Hue

Saturation

Value (brightness)
Above, we can see each channel of the picture split into HSV (Note, that in order to visualize the hue channel, it is represented as linear scale. In “reality”, this is a circle, so black would be right next to white in this representation). Most colors in the window are saturated strongly, so the saturation channel is very bright. Only the (in the original) white areas have a low saturation and are therefore black. Also compare the brightness to the original: it catches the overall impression of the image — something that was not represented in a single RGB channel.
Summary and outlook
We now have two ways of describing colors. And if you pay attention, you will find these color models in a lot of imaging applications. Next time when you open your image editor of choice pay close attention — the color picker usually has a HSV layout. Try to identify these three aspects in Paint or Photoshop!
You should also think about these models when you try to select features on a colored picture or photograph — software like ImageJ offers threshold methods not only in RGB but also in HSV. And sometimes this model can make image processing and feature detection way easier.
Image sources
The images used are in the public domain, the originals can be found via the links below:
- Chagall Window: Thad Zajdowicz
- Beach photo: Joe deSousa